HTML('''<script>
code_show=true;
function code_toggle() {
 if (code_show){
 $('div.input').hide();
 } else {
 $('div.input').show();
 }
 code_show = !code_show
}
$( document ).ready(code_toggle);
</script>
<form action="javascript:code_toggle()"><input type="submit" value="Click here to toggle on/off the raw code."></form>''')
import numpy
import matplotlib.pyplot as plt
from IPython.display import HTML
plt.rcParams["figure.figsize"] = (10,3)
%matplotlib inline
Video discussion of the content on this page
Some context
This document is a supplement for the Mandelbrot Visualizer.
Ultimate objective
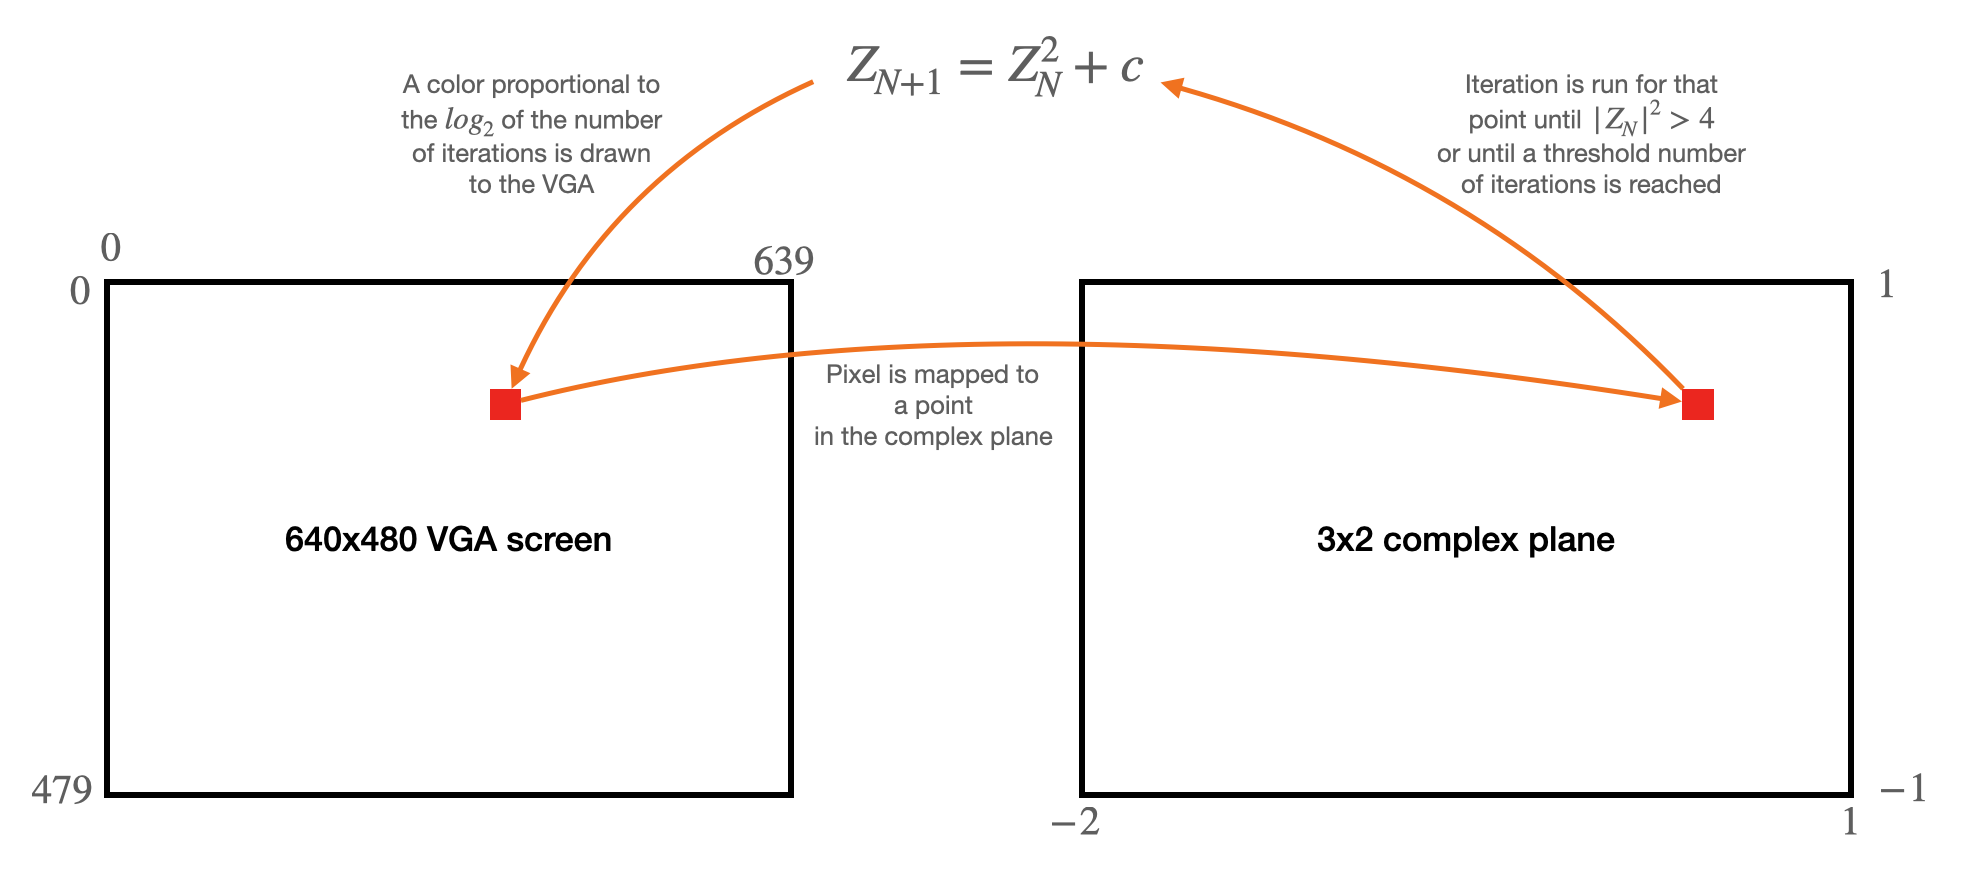
To render the images shown above on the VGA display, we will iterate the function below a lot.
\begin{align} Z_{N+1} &= Z_N^2 + c\\ Z_0 = 0 \end{align}For each choice of $c$, we will determine whether the magnitude of the complex number diverges to infinity or not. If it diverges, it is outside the Mandelbrot set. If not, it is inside. So, specifically . . .
- Choose some threshold number of iterations to test. Say, 1000 (but this will be configurable).
- Map a particular pixel to a $c$ value.
- Run the iteration for that particular $c$ value.
- If you reach 1000 iterations without the complex magnitude exceeding 2, assume that point is in the Mandelbrot set, and color it accordingly.
- If $||𝑍||>2$, assign that pixel a color that maps to the log of the number of iterations that it took to reach 2.
- Move on to the next pixel.
This process is illustrated below.
As is often the case, it is best to start in Matlab or Python, get the algorithm working, and then confirm the correctness of your Verilog against the Matlab or Python implementation.
Matlab
Bruce wrote the following Matlab script, which will calculate and render the Mandelbrot Set. Note that Matlab abstracts away the complex arithmetic. C and Verilog do not. So, we'll briefly review this arithmetic in the next section.
clear all
figure(1); clf;

termination = 100;
x = linspace(-2,1,640);
y = linspace(-1,1,480);
x_index = 1:length(x) ;
y_index = 1:length(y) ;
img = zeros(length(y),length(x));

N_total = 0;
for k=x_index
    for j=y_index
        z = 0;
        n = 0;
        c = x(k)+ y(j)*i ;%complex number
        while (abs(z)<2 && n<termination)
            z = z^2 + c;
            n = n + 1;
            N_total = N_total + 1;
        end
        img(j,k) = log2(n);
    end
end
N_total
imagesc(img)
colormap(jet)
right = 482;
left = 320;
top = 122 ;
line ([left right],[top top],'color','k')
line ([left right],[240+top 240+top],'color','k')
line ([left left],[top 240+top],'color','k')
line ([right right],[top 240+top],'color','k')
x(right);
x(left);
y(top);
Review of complex arithmetic
We have the following iteration:
\begin{align} Z_{N+1} &= Z_N^2 + c\\ Z_0 &= 0 \end{align}We could expand our iteration into real and imaginary parts:
\begin{align} Z_R^{N+1} + j Z_i^{N+1} &= (Z_R^N + jZ_i^N)(Z_R^N + jZ_i^N) + C_R + jC_i \end{align}We could expand all of this and separate into real and imaginary parts to get the following equations:
\begin{align} Z_R^{N+1} &= (Z_R^N)^2 - (Z_i^N)^2 + C_R\\ Z_i^{N+1} &= 2Z_R^NZ_i^N + C_i \end{align}Once we've calculated $Z_R^{N+1}$ and $Z_i^{N+1}$, we'll determine whether the magnitude of this complex number has exceeded two. (Actually, we'll determine whether the square of the magnitude has exceeded 4).
\begin{align} (Z_R^{N+1})^2 + (Z_i^{N+1})^2 >4 (?) \end{align}Save these squared values for the next iteration! You can save yourself half the arithmetic (and 2 multipliers).
Implementing this arithmetic in Python
Here is some example code which implements the above complex arithmetic in Python:
def iterate(ci, cr, max_iterations):

    iterations = 0

    zi = 0
    zr = 0

    for i in range(max_iterations):
        iterations += 1

        zr_temp = zr*zr - zi*zi + cr
        zi_temp = 2*zr*zi + ci

        zi = zi_temp
        zr = zr_temp

        if ((zi*zi + zr*zr) > 4):
            break

    return iterations
Implementing this arithmetic in C
See the University Computer Page, Mandelbrot example.
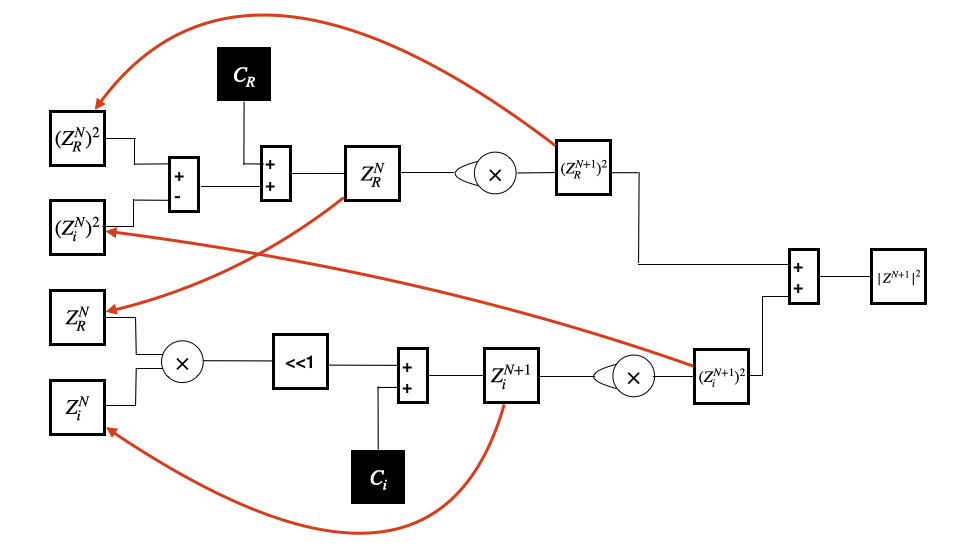
Implementing this arithmetic in Verilog
In Verilog, you will build the hardware illustrated below.
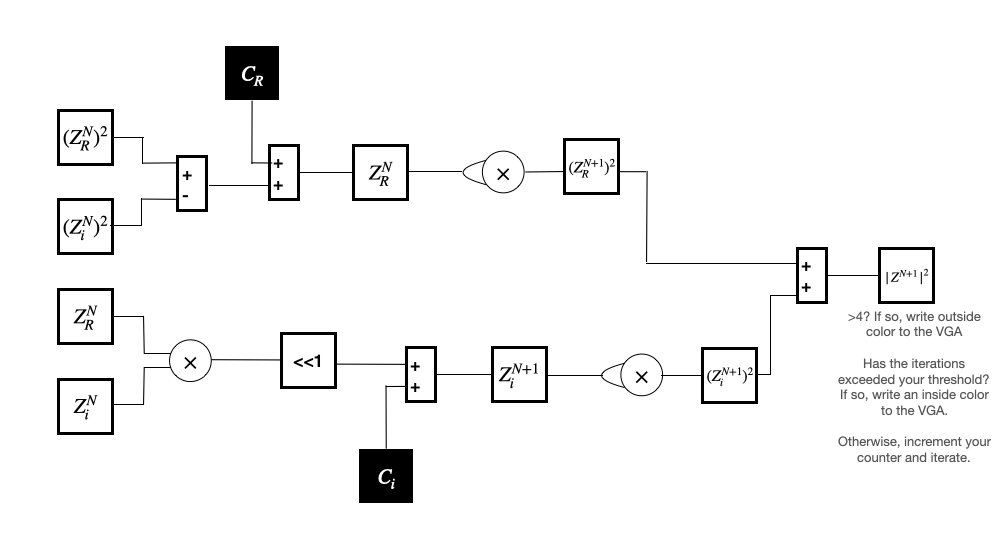
Between iterations, save the values for $z_i$, $z_R$, and their squares!
Parallelization and load balancing
To render the Mandelbrot Set as quickly as possible, you will want to be running the iteration on as many pixels simultaneously as you can with the hardware available on the FPGA. Think carefully about load balancing among your parallel solvers! Which of the below options best balances the load among four parallel solvers?
x = numpy.linspace(-2, 1, 70)
y = numpy.linspace(-1, 1, 31)
X, Y = numpy.meshgrid(x, y)
plt.figure(2, figsize=(12, 8))
im = plt.imread('three.png')
implot = plt.imshow(im, zorder=1, alpha=0.25)
for i in range(len(x)):
    for j in range(len(y)):
        if (i<(len(x)/2) and j<((len(y)/2))):
            plt.plot(((x[i]+2)/3.)*1500, ((y[j]+1)/2.)*1200, 'b.', zorder=2)
        elif (i>=(len(x)/2) and j<((len(y)/2))):
            plt.plot(((x[i]+2)/3.)*1500, ((y[j]+1)/2.)*1200, 'r.', zorder=2)
        elif (i<(len(x)/2) and j>=((len(y)/2))):
            plt.plot(((x[i]+2)/3.)*1500, ((y[j]+1)/2.)*1200, 'g.', zorder=2)
        else:
            plt.plot(((x[i]+2)/3.)*1500, ((y[j]+1)/2.)*1200, 'y.', zorder=2)
plt.axis('off')
plt.show()
plt.figure(2, figsize=(12, 8))
im = plt.imread('three.png')
implot = plt.imshow(im, zorder=1, alpha=0.25)
for i in range(len(x)):
    for j in range(len(y)):
        if (j%4==0):
            plt.plot(((x[i]+2)/3.)*1500, ((y[j]+1)/2.)*1200, 'b.')
        elif (j%4==1):
            plt.plot(((x[i]+2)/3.)*1500, ((y[j]+1)/2.)*1200, 'r.')
        elif (j%4==2):
            plt.plot(((x[i]+2)/3.)*1500, ((y[j]+1)/2.)*1200, 'g.')
        else:
            plt.plot(((x[i]+2)/3.)*1500, ((y[j]+1)/2.)*1200, 'y.')
plt.axis('off')
plt.show()
plt.figure(2, figsize=(12, 8))
im = plt.imread('three.png')
implot = plt.imshow(im, zorder=1, alpha=0.25)
for i in range(len(x)):
    for j in range(len(y)):
        if (i%2 == 0):
            if (j%2 == 0):
                plt.plot(((x[i]+2)/3.)*1500, ((y[j]+1)/2.)*1200, 'b.')
            else:
                plt.plot(((x[i]+2)/3.)*1500, ((y[j]+1)/2.)*1200, 'r.')
        else:
            if (j%2 == 0):
                plt.plot(((x[i]+2)/3.)*1500, ((y[j]+1)/2.)*1200, 'g.')
            else:
                plt.plot(((x[i]+2)/3.)*1500, ((y[j]+1)/2.)*1200, 'y.')
plt.axis('off')
plt.show()


