Data that must be visualized
You must visualize two pieces of information in realtime:
- The lever arm angle, as estimated by the complementary filter
- The calculated control input to the motor - low-passed!
These data will be critical for debugging your system! The calculated control input will likely be rather noisy. For that reason, you must low-pass the PID-computed PWM ontime for visualization.
Options for visualizing that data
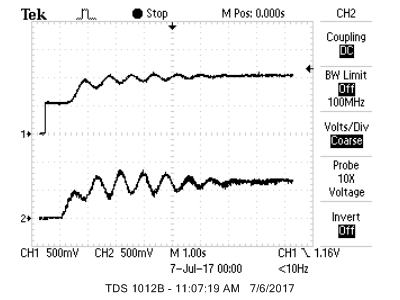
For data visualization, you may either use the DAC and oscilloscope or the VGA display. Each has its merits! If you choose to use the DAC, then your ISR will include two SPI transactions to channels A and B of the DAC. You will send the raw ADC measurement to channel A, and the low-passed control input to channel B (the next section discusses how to do this low-passing). Then, you can use the oscilloscope to set the time/volts per division to something that looks good, like in the image below. This is fast, easy, and works really well. Even if you plan to build a VGA interface, it may be a good idea to start by using the DAC.
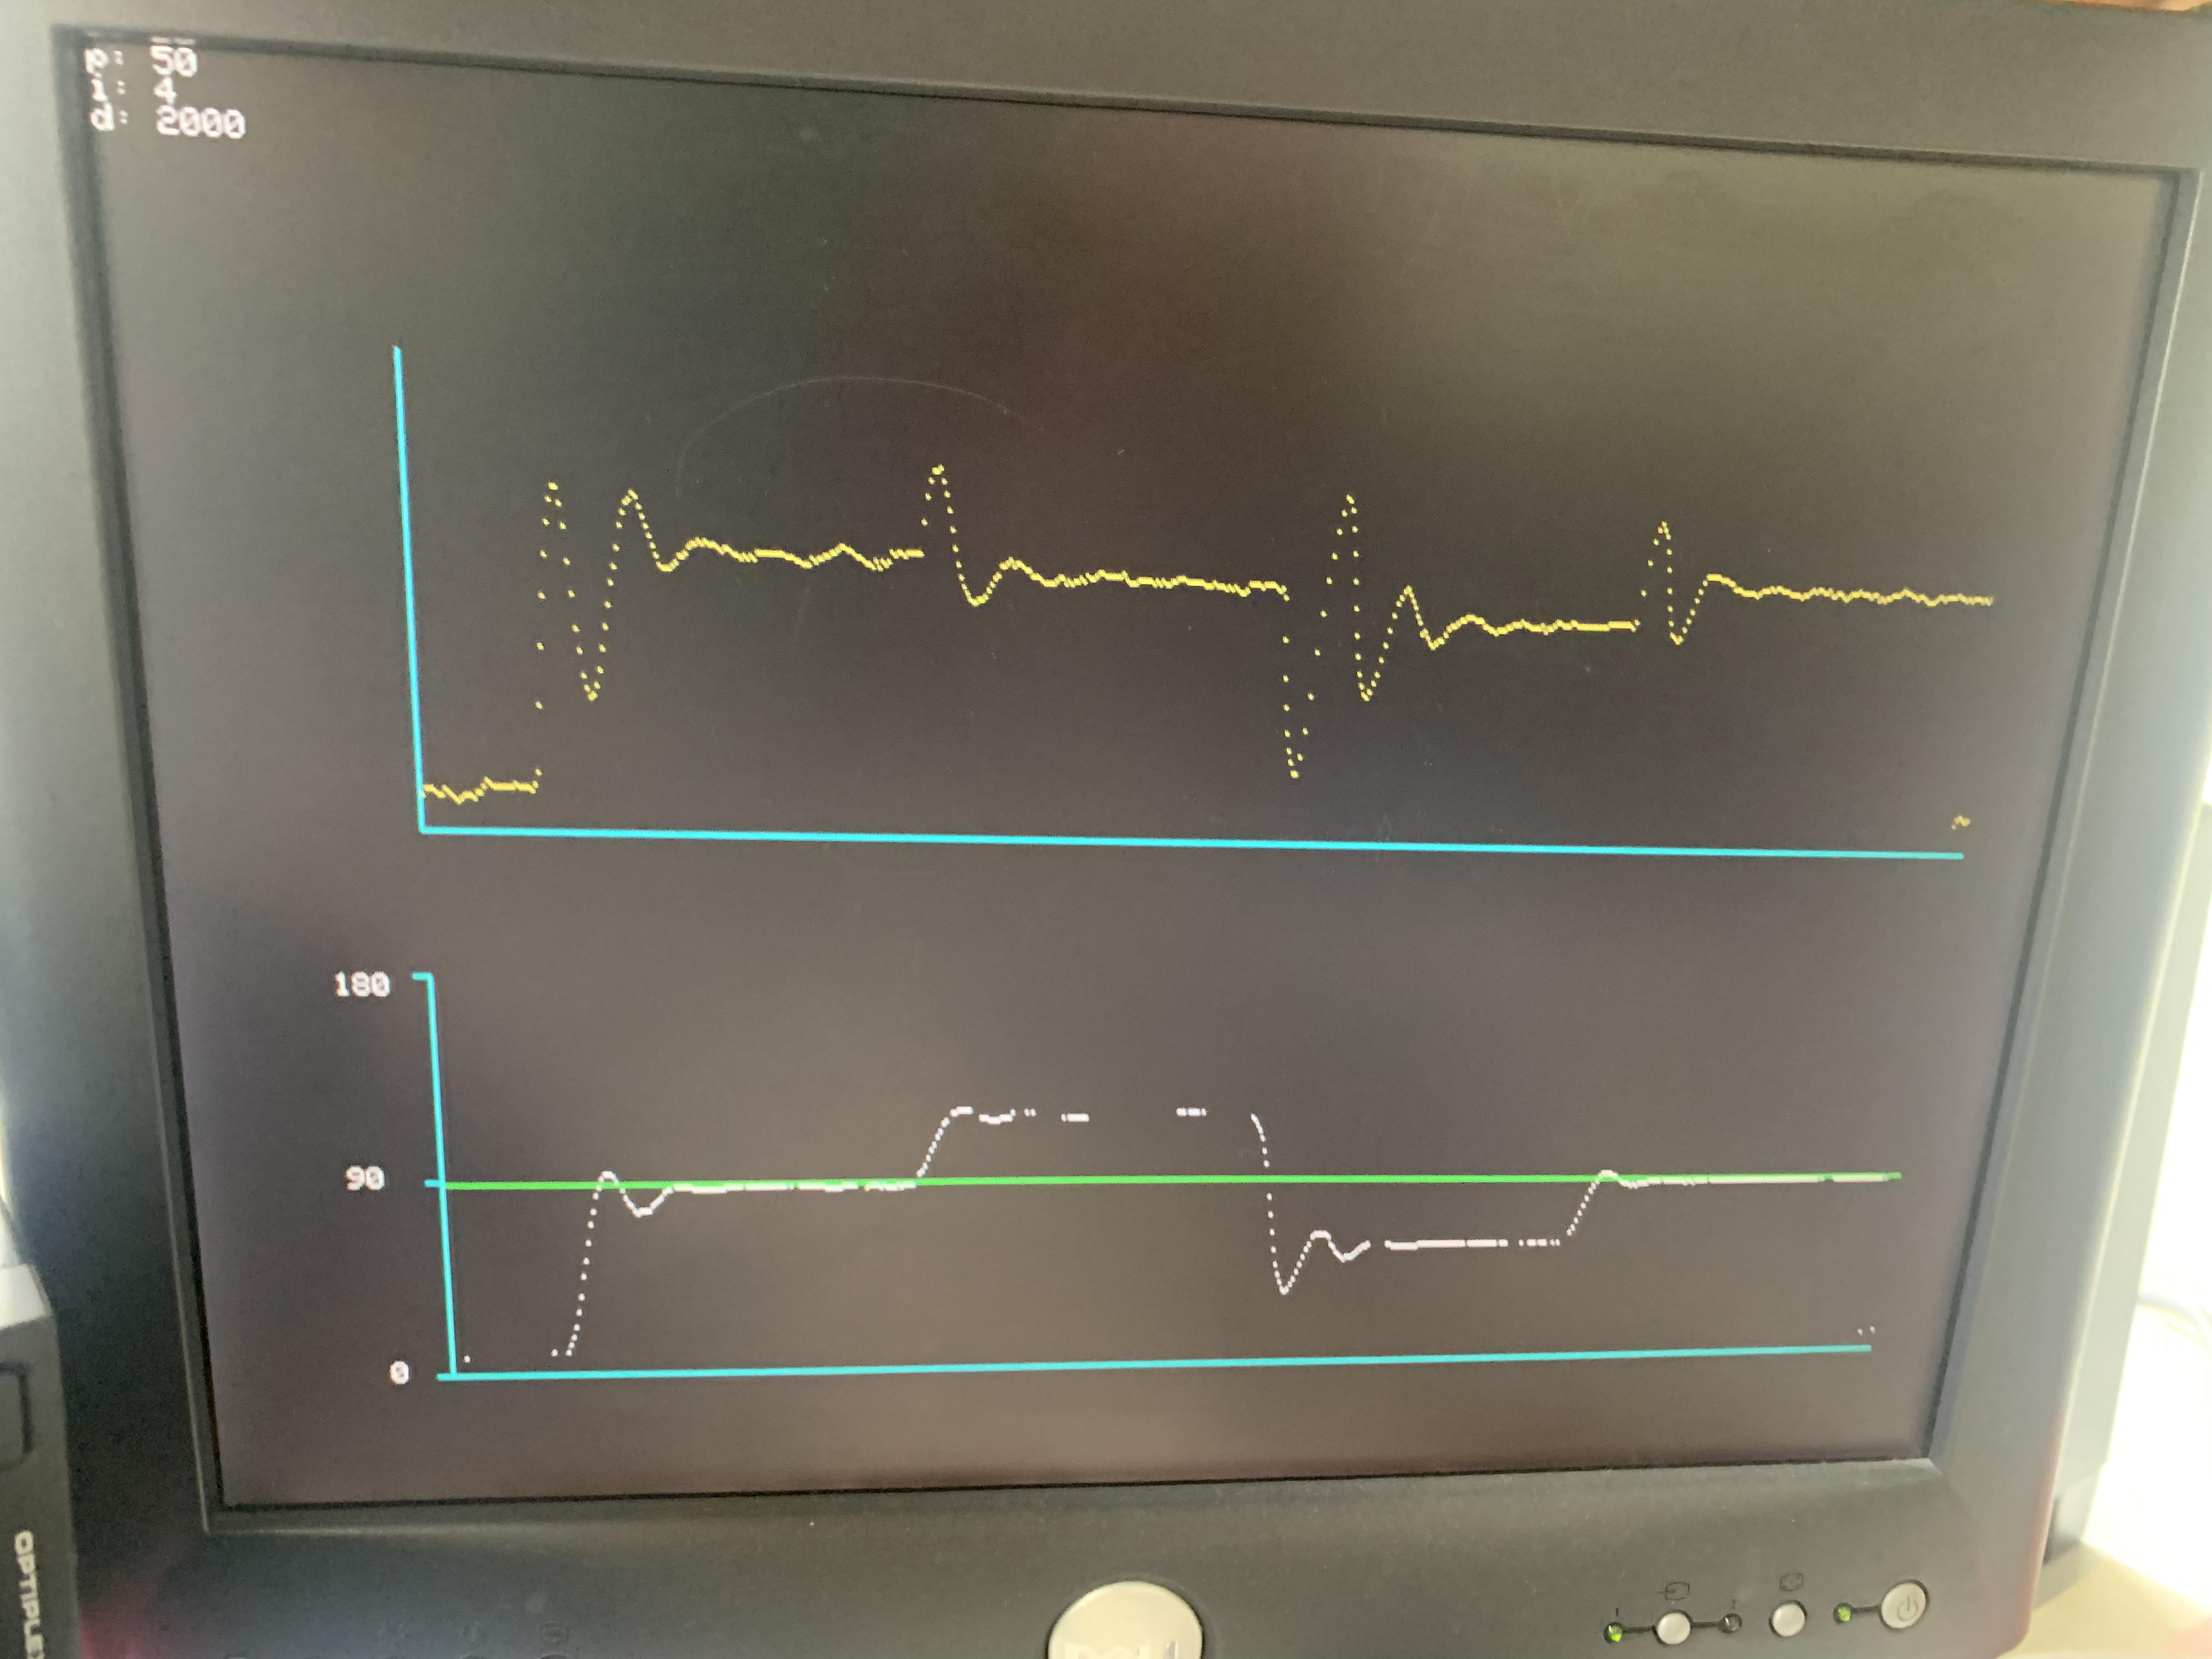
Alternatively, you may build a data visualization on the VGA display. To do this, you will add a protothread that draws to the VGA display. Your ISR will signal for the protothread to run via a semaphore or some other mechanism, then the thread will draw to the screen (scaling the ADC measurement and low-passed control input as necessary). This is more difficult, but perhaps also creates a nicer user experience. If you implement a VGA visualization, I recommend you start from the graphics primitives example on this webpage.
Low-passing the PID-computed control
If you use a very large derivitive term in the PID controller to stabilize the oscillations, you may need to lowpass filter the motor signal to display on the scope. Consider using a first order IIR, digital lowpass, with a time constant of about 16 PWM samples, given by:
motor_disp = motor_disp + ((pwm_on_time - motor_disp)>>4) ;
(where pwm_on_time is the output of the PID controller, and motor_disp is the low-passed version that gets displayed). If you find that the signal still looks too noisy, increase the amount by which you shift the second term.
Why is does the above code work as a low-pass filter?
By the way, why is this a low pass filter? We can arrive at the answer by considering a classic RC lowpass filter, as shown below:
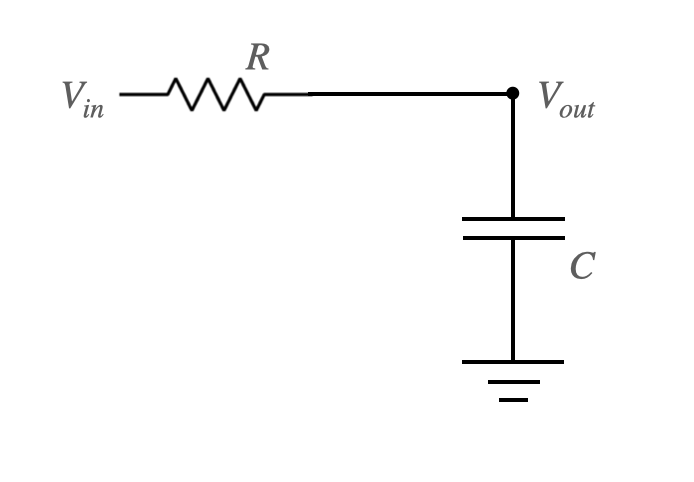
Because the resistor and capacitor are in series, we know that the current through each is the same:
\begin{align} i_r = \frac{V_{in} - V_{out}}{R} = i_c = C \frac{dV_{out}}{dt} \end{align}Rearrange to solve for $\frac{dV_{out}}{dt}$:
\begin{align} \frac{dV_{out}}{dt} &= \frac{1}{RC}\left(V_{in} - V_{out}\right) \end{align}Let us now discretize this equation. To do so, we'll use the following notation:
\begin{align} V_{out}(t) &= V^N\\ V_{out}(t+\Delta t) &= V^{N+1} \end{align}Taylor expand the second expression above:
\begin{align} V(t + \Delta t) &\approx V(t) + \left[\frac{dV_{out}}{dt}\right]_t\Delta t\\ \end{align}Using our notation, this becomes:
\begin{align} V^{N+1} &\approx V^N + \left[\frac{dV_{out}}{dt}\right]_t\Delta t\\ \end{align}Substitute the previous expression for $\frac{dV_{out}}{dt}$:
\begin{align} V^{N+1} &\approx V^N + \frac{\Delta t}{RC}\left(V_{in} - V^N\right) \end{align}The above expression maps directly to motor_disp = motor_disp + ((pwm_on_time - motor_disp)>>4) ;.
The time constant for the above lowpass filter is $RC$ seconds. However, if we change units from seconds to PWM units, the time constant is $\frac{RC}{\Delta t}$. So, if we shift-right by 4, then the above filter has a cutoff frequency at 16 PWM units. If we shift by 5, it has a cutoff frequency at 32 PWM units. And so on.